.png)


Measure email marketing success for higher DTC retention

TL;DR:
- Most DTC brands rely on unreliable open rate metrics due to privacy changes, which distort true engagement. They should instead focus on revenue-driven KPIs like placed order rate and customer LTV, tracking flows separately from campaigns to improve retention. Building accurate attribution models and maintaining list hygiene are essential for trustworthy measurement and long-term growth.
Most DTC marketing teams are measuring email success the wrong way. They’re staring at open rate dashboards, celebrating spikes that have nothing to do with real customer behavior, and making strategic decisions based on data that privacy changes have rendered almost meaningless. Most teams track opens and clicks but fail to connect email impact to actual revenue and retention outcomes. If you’re running email for an elevated DTC brand, this gap between what you’re measuring and what actually drives repeat purchase is probably costing you more than you realize. This article walks through a practical, multi-layered framework for measuring what matters.
Table of Contents
- Why traditional success metrics fall short
- The new KPI stack: Building a layered measurement framework
- Campaigns vs. flows: What actually drives retention success
- Attribution and retention: Making your measurement truly actionable
- Deliverability, list hygiene, and ROI: The non-negotiables of trustworthy measurement
- The uncomfortable truth most DTC marketers won’t admit about email success measurement
- Take your retention measurement to the next level
- Frequently asked questions
Key Takeaways
| Point | Details |
|---|---|
| Opens are outdated | Due to privacy updates, clicks and conversions matter far more than open rates for measuring engagement. |
| Use a two-layer KPI stack | Combine engagement quality and commercial impact metrics for a full view of email success. |
| Flows beat campaigns | Automated flows drive substantially higher retention and revenue than traditional one-off campaigns. |
| Attribution shapes results | Proper attribution windows and models are critical for fair measurement of email-driven retention. |
| Retention relies on hygiene | List health and CRM integration are non-negotiable for accurate, actionable ROI measurement. |
Why traditional success metrics fall short
The moment Apple launched Mail Privacy Protection (MPP) in late 2021, open rates became a compromised metric. Yet the majority of email marketing reports still lead with opens. This is a problem that compounds over time, because every optimization decision built on inflated open data drives you further from the truth.
Here’s what’s actually happening when you lean too hard on open rates:
- Phantom opens inflate your numbers. MPP pre-fetches emails on Apple devices regardless of whether a human actually opens them. Open rates are increasingly unreliable for measuring true engagement, and with Apple Mail’s market share hovering around 50% or more in many DTC segments, you may be seeing double the real engagement.
- You suppress the wrong people. If your segmentation uses opens to define “active” subscribers, you’ll keep mailing dead addresses and suppress genuinely engaged customers who happen to use Apple Mail.
- You celebrate the wrong campaigns. A subject line optimized for open rate may actually depress click-throughs and conversions. You won’t see that trade-off unless you measure downstream.
- Deliverability suffers silently. Over time, sending to large pools of “openers” who aren’t truly engaged raises spam complaint rates and tanks your sender reputation, a problem that surfaces only after serious damage is done.
Understanding the data privacy impact on your open rate reporting is the first step toward building a measurement practice that actually reflects customer behavior. And when you look at 2025 email benchmarks, the gap between open-rate leaders and true revenue performers is striking.
“The brands winning at retention aren’t chasing open rates. They’re obsessing over clicks, placed order rates, and revenue per recipient. Open rate culture is the single biggest measurement trap in DTC email.”
Clicks, replies, and conversion events are what you should be tracking as primary engagement signals. They require intentional action from a real human, and they connect directly to downstream revenue. That’s the starting point for building a better framework.
The new KPI stack: Building a layered measurement framework
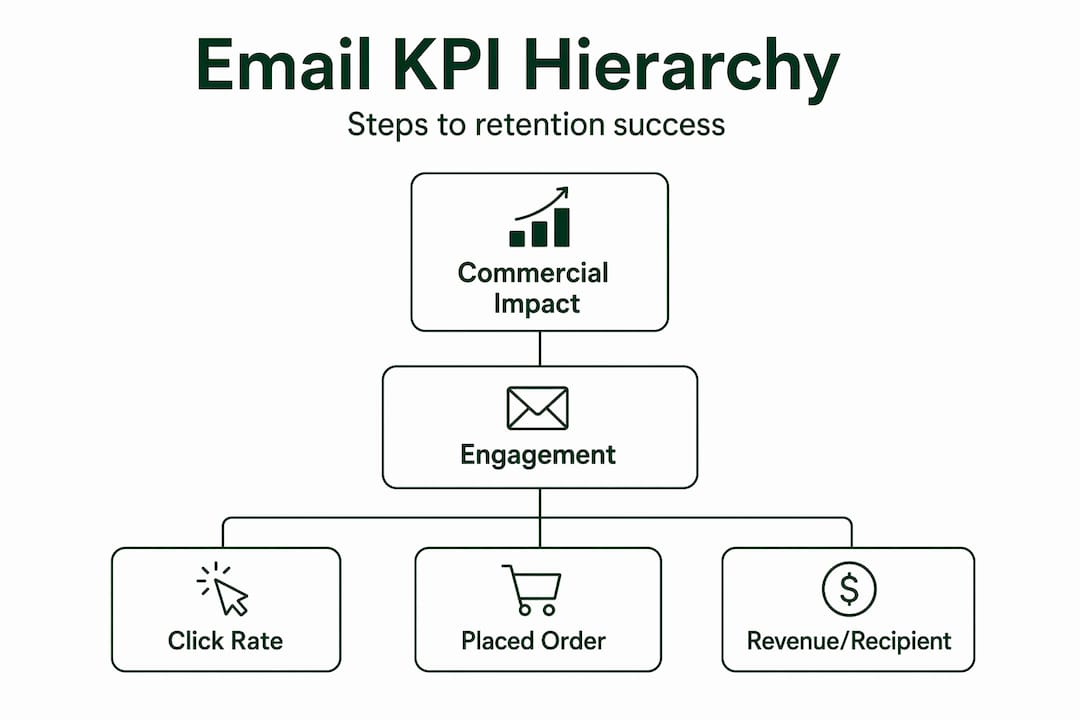
A modern email measurement approach uses two layers of KPIs that work together. Think of it as a funnel: the first layer measures how well your emails earn attention and trust, and the second layer measures how that attention converts into revenue and long-term customer value.
Layer 1: Engagement quality KPIs
These metrics tell you whether your emails are actually landing and resonating. They include:
- Deliverability rate (inbox placement, not just delivery): Are your emails reaching the inbox, or disappearing into spam folders?
- Click-through rate (CTR): The clearest signal that your content is relevant enough to inspire action.
- Click-to-open rate (CTOR): Normalizes clicks against actual opens (useful for ESP-level reporting where you can isolate non-MPP opens).
- Reply rate: Especially for nurture flows, replies signal deep engagement and trust.
- Unsubscribe and spam complaint rate: Leading indicators of list health and content relevance.
Layer 2: Commercial impact KPIs
These metrics connect email activity to business outcomes. Funnel-based KPIs are essential here, and you need all of them to see the full picture.
| KPI | What it answers | Why it matters for DTC |
|---|---|---|
| Placed order rate | Is email driving purchases? | Most direct conversion signal |
| Revenue per recipient | What’s each send worth? | Enables send-level ROI comparison |
| Customer lifetime value (LTV) | Is email building loyalty over time? | Core retention health indicator |
| Repeat purchase rate | Are customers coming back? | Tied directly to flow performance |
| Revenue attributed to email | What’s the channel’s total commercial impact? | Justifies budget and strategy |
Looking at top email KPIs together gives you what individual metrics cannot: a complete view of whether your email program is truly earning its place in your retention stack.
Pro Tip: Set a weekly KPI review cadence that covers at least one metric from each layer. If you only review one layer, you’ll either optimize for engagement without commercial results or chase revenue without understanding why performance shifts.
Campaigns vs. flows: What actually drives retention success
Not all emails are created equal, and your measurement framework needs to reflect that. Campaign sends (like promotional broadcasts, newsletters, or product launches) and automated lifecycle flows (like welcome series, post-purchase sequences, win-back flows, and replenishment reminders) perform very differently and should be benchmarked separately.
The performance gap is significant. Flows massively outperform campaigns for clicks, conversions, and revenue per recipient. In many DTC segments, lifecycle flows deliver 13 to 18 times higher order rates compared to campaign sends. That’s not a small edge, it’s a fundamentally different category of performance.
Here’s a practical benchmark comparison:
| Metric | Campaign sends | Lifecycle flows |
|---|---|---|
| Click-through rate | 1.0% to 2.5% | 3.5% to 7.0% |
| Placed order rate | 0.05% to 0.15% | 0.5% to 1.8% |
| Revenue per recipient | $0.05 to $0.25 | $0.60 to $2.50+ |
| Unsubscribe rate | 0.2% to 0.5% | 0.05% to 0.2% |
These aren’t just numbers to report. They’re decision inputs. If your welcome series placed order rate is sitting at 0.3% when the benchmark is 0.8%, that’s a specific, fixable problem worth real budget to solve.
Here’s how to use this strategically:
- Set separate KPI targets for flows and campaigns. Comparing them against the same benchmark distorts both.
- Audit flows quarterly for revenue per recipient and placed order rate. Flows run on autopilot, which means performance decay can go unnoticed for months.
- Use campaigns to support flow performance. A well-timed promotional campaign to recent buyers can reactivate purchase intent that flows then nurture into repeat orders. Understanding email retention frequency is critical for calibrating this balance without burning out your list.
- Track flow coverage. What percentage of your customer base is enrolled in at least one active flow? Gaps in flow coverage represent direct retention risk.
The strategic insight here is that campaigns show up in your quarterly revenue numbers, but flows build the retention foundation that determines whether your brand compounds or stagnates over time.
Attribution and retention: Making your measurement truly actionable
You’ve built your KPI stack. You’ve segmented flows from campaigns. Now comes the part that quietly undermines most DTC email reporting: attribution. Specifically, how you assign credit for revenue to email touches.
Attribution models and windows directly change what gets counted as email-driven revenue, sometimes by 40% to 60% depending on configuration. This is not a technical footnote. It determines whether your email program looks like a growth engine or a cost center to your leadership team.
The most common mistake is last-click attribution with a long window (say, 30 days). This setup claims credit for every purchase made within 30 days of any email click, even if the customer saw 12 other touchpoints, ran a Google search, saw a paid ad, and then bought three weeks later. Your email “drove” that sale in the report, but the reality is far messier.
Here’s a checklist for building an unbiased retention attribution practice:
- Choose an attribution window that matches your buying cycle. For replenishment DTC products with 30 to 45 day cycles, a 7 to 14 day window is typically most honest. For high-consideration purchases, extend to 14 to 21 days.
- Use multi-touch or linear attribution rather than last-click wherever your ESP or analytics platform supports it. This distributes credit across the actual journey.
- Compare attributed revenue to total store revenue as a sanity check. If email claims credit for more than 60% of revenue and you’re also running paid social, influencer, and SEO, something is misconfigured.
- Separate new customer revenue from repeat customer revenue in your attribution reporting. Email’s real retention story lives in the repeat purchase numbers.
- Document your attribution settings and enforce consistency across reporting periods. Changing your window mid-quarter will make your data unreadable.
- Evaluate retention impact over rolling 90-day and 12-month periods, not just in campaign-by-campaign snapshots, to see true LTV contribution.
For a structured approach to practical ROI measurement, standardize your model across your ESP, your e-commerce platform, and your internal reporting before drawing any conclusions about email’s contribution.
Pro Tip: Run a monthly attribution reconciliation: pull email-attributed revenue from your ESP and compare it against the same cohort’s actual purchase data in your e-commerce platform. Consistent discrepancies signal a configuration problem worth fixing before it compounds across quarters.
Deliverability, list hygiene, and ROI: The non-negotiables of trustworthy measurement
All your KPI discipline means nothing if your emails aren’t reaching inboxes, or if your list is full of addresses that haven’t engaged in 18 months. Deliverability and list health are the infrastructure that your measurement practice runs on. Without clean inputs, you cannot trust any output.

Success measurement should include list health signals, periodic suppression reviews, and clear revenue connection through CRM or e-commerce integrations. These aren’t optional extras. They’re the foundation.
Key actions for maintaining trustworthy measurement:
- Suppress inactives proactively. Segment subscribers who haven’t clicked or purchased in 90 days and run a re-engagement flow before suppressing them entirely. Carrying dead weight inflates your list size and destroys your deliverability metrics.
- Monitor spam complaint rates in real time. A complaint rate above 0.08% (Google’s threshold) will trigger deliverability issues. Keep it below 0.05% to stay well clear of the danger zone.
- Track inbox placement rate separately from delivery rate. An email can be “delivered” and still land in spam. Use a seed-based inbox monitoring tool to know what’s really happening.
- Connect your ESP to your CRM and e-commerce platform. A practical ROI measurement approach requires tying email behavior directly to purchase history, customer segments, and LTV data. Without this integration, you’re measuring in a vacuum.
- Review bounce rates monthly. Hard bounces above 2% signal list quality problems. Soft bounce trends can indicate emerging deliverability issues before they escalate.
“You cannot measure something accurately with broken instruments. List hygiene and CRM integration are not technical tasks, they’re measurement prerequisites.”
Following email retention best practices on deliverability and improving email deliverability should be treated as revenue-critical work, not IT maintenance. And for a broader view of how these inputs affect your results, revisiting your core understanding of email metrics with fresh eyes after tightening your list will often reveal performance improvements that were being hidden by noisy data.
The uncomfortable truth most DTC marketers won’t admit about email success measurement
Here’s what years of working with 8-figure DTC brands has made clear: most email optimization cycles are running on bad inputs. Teams are split testing subject lines, tweaking send times, and debating creative direction, all while their underlying measurement is fundamentally broken. The optimization is real. The feedback loop is not.
The brands that actually outperform, the ones quietly compounding their repeat purchase rates year over year, have invested in three unglamorous things: technical integrations that connect email behavior to real revenue, KPI discipline that filters out vanity metrics ruthlessly, and benchmark frameworks that compare flows and campaigns separately with context-specific targets.
What’s surprising is how rarely this shows up in marketing conference talks or industry trend reports. Everyone wants to discuss creative strategy and AI personalization. Nobody wants to talk about cleaning up attribution windows or suppressing inactives. But the brands winning at retention in 2026 are doing the boring infrastructure work first and building creative strategy on top of it.
The other uncomfortable truth: most DTC brands are underinvesting in lifecycle flows relative to campaign sends. Campaigns are visible, they feel like marketing, and they create urgency around launches and promotions. Flows run quietly in the background. But as the benchmark data shows, flows are where the real retention leverage lives. ROI measurement wins consistently come from brands that have built and continuously optimized their flow architecture, not from those who send more campaigns.
If you want to compete on retention, start with measurement. Not as an afterthought. As the strategy.
Take your retention measurement to the next level
The frameworks in this article give you a clear path from open-rate confusion to commercially grounded email measurement. But knowing what to measure is only the beginning. Putting it into practice, connecting your ESP to your CRM, rebuilding your attribution model, auditing your flow architecture, requires both strategic clarity and hands-on execution. The Email Marketers specializes in exactly this work for elevated DTC brands. Explore our real-world case studies to see how retention measurement translates into measurable revenue growth. Or step inside the Retention Lab to see how we build performance systems for brands at scale. And if you’re ready to put the right tools in your team’s hands, the Retention Toolkit is your next step.
Frequently asked questions
What’s the best metric to measure retention impact from email?
Placed order rate and revenue per recipient, particularly segmented by triggered lifecycle flows, are the most reliable DTC retention metrics. For DTC, flows deliver significantly higher order and revenue results than campaigns, making flow-specific measurement essential.
How long should my attribution window be for DTC email?
Select a window that reflects your typical buying cycle, usually 5 to 14 days for repeat-purchase DTC categories, and apply a linear or multi-touch model to avoid inflated results. Attribution models and windows directly affect what gets counted as email-driven revenue, so consistency in your settings matters as much as the window length itself.
Why shouldn’t I trust open rates to measure engagement?
Privacy tools like Apple MPP pre-fetch emails and trigger opens automatically, with no human action required. Open rates are unreliable because privacy tools artificially inflate them, so clicks and conversions are far more trustworthy engagement signals.
How often should I suppress inactive email subscribers?
Review and suppress inactives at minimum every 60 to 90 days to protect sender reputation and deliverability. Suppressing after 90 days of inactivity is the recommended baseline for preserving list health and ensuring your measurement reflects real audience engagement.
How do I prove email ROI to stakeholders?
Connect your email platform data directly to CRM or e-commerce purchase records for real revenue attribution, not just engagement metrics. ROI is clearest when email outcomes are tied into contact-level and pipeline data, giving stakeholders a number they can compare against channel spend.


