.png)


Good Email Deliverability Rate: 84-89% Benchmarks

TL;DR:
- Up to 11% of marketing emails may never reach the inbox due to spam filtering.
- Inbox placement rate, not just delivery rate, determines actual email visibility and engagement.
- Top brands aim for above 90% inbox placement, using authentication, list hygiene, and monitoring.
Most e-commerce marketers pour energy into subject lines, design, and copy without realizing that none of it matters if the email never reaches the inbox. There is a quiet but costly gap between emails your server accepts and emails your subscribers actually see. Global inbox placement averages sit around 83 to 89%, meaning roughly 1 in 8 emails misses the inbox entirely. That gap directly erodes your ROI, your open rates, and your retention strategy. This guide breaks down what a “good” deliverability rate actually looks like, how to benchmark your performance, and what the top e-commerce brands do differently to stay above the pack.
Table of Contents
- Defining deliverability: Going beyond ‘delivered’
- Industry benchmarks: What is a good deliverability rate?
- Factors impacting deliverability rates for e-commerce brands
- Testing and monitoring: Maintaining high deliverability
- Why aiming for ‘great’ beats settling for ‘good’ deliverability
- Expert help to boost your deliverability rates
- Frequently asked questions
Key Takeaways
| Point | Details |
|---|---|
| Inbox is what counts | A high deliverability rate means more emails actually reach the inbox, not just the server. |
| Benchmarks for success | Aim for at least 84-89% inbox placement, with leaders pushing above 90%. |
| Technical setup matters | Authenticate your sending domain and keep lists clean to avoid issues and boost engagement. |
| Continuous monitoring | Ongoing testing and list maintenance are essential for sustained high rates. |
Defining deliverability: Going beyond ‘delivered’
Now that we have established why deliverability matters, let us break down what marketers actually measure and what gets missed.
When your ESP (email service provider) reports a 99% delivery rate, it sounds like a win. But that number only tells you how many emails were accepted by recipient mail servers. It says nothing about where those emails landed. A message accepted by Gmail’s server can still end up in the spam folder, and that subscriber will never see your campaign.
Inbox placement rate, which is what we mean when we talk about true email deliverability, measures the percentage of emails that reach the primary inbox. That is the number that actually correlates with opens, clicks, and revenue.
Here is how the key terms break down:
- Delivery rate: The percentage of emails accepted by receiving mail servers (not bounced). Target: 98% or above.
- Inbox placement rate: The percentage of delivered emails that land in the primary inbox, not spam or junk.
- Hard bounce: A permanent delivery failure, usually due to an invalid address.
- Soft bounce: A temporary failure, often from a full mailbox or server issue.
- ISP (Internet Service Provider): Companies like Gmail, Outlook, and Yahoo that host recipient email accounts and decide where your message lands.
As email deliverability benchmarks confirm, delivery rate should sit at 98% or above, but inbox placement is the metric that actually drives engagement. A brand celebrating a 99% delivery rate while sitting at 65% inbox placement is losing a third of its audience to the spam folder.
“Getting into the inbox is not a technical checkbox. It is the foundation of every retention strategy. If your message does not land in front of your customer, your campaign does not exist.”
Pro Tip: Always track both delivery rate and inbox placement rate inside your ESP. If those two numbers diverge significantly, you have a spam folder problem, not a delivery problem. Understanding improving deliverability starts with measuring the right metric.
Industry benchmarks: What is a good deliverability rate?
With the right terms in hand, let us see how your rates stack up to industry standards and competitors.
The honest answer is that “good” depends on who you are sending to, but there are consistent numbers that set the bar. According to current data, global inbox placement averages between 83 and 89%, with top-performing senders consistently clearing 90%.
Here is how inbox placement breaks down by major email provider:
| Email provider | Average inbox placement |
|---|---|
| Gmail | 87 to 90% |
| Outlook/Hotmail | ~76% |
| Yahoo/AOL | ~80 to 84% |
| Apple Mail | ~88 to 91% |
| Global average | 83 to 89% |
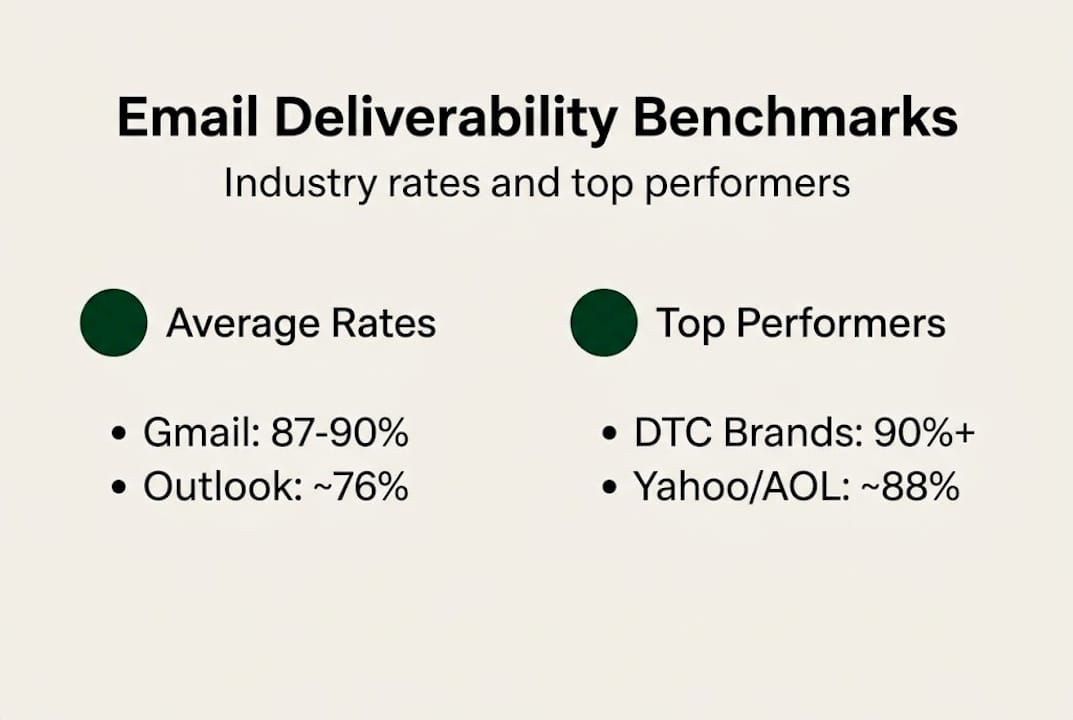
Outlook stands out as the toughest inbox to crack, with placement rates significantly lower than Gmail or Apple Mail. If your customer base skews toward business email users on Microsoft platforms, this is a number worth watching closely in your latest benchmark data.
For e-commerce brands specifically, here is a simple tiered view of deliverability performance:
- Strong (90%+): You are outperforming the industry average. Engagement signals are healthy. Keep doing what you are doing and push for consistency.
- Acceptable (84 to 89%): You are in line with the global average. There is room to improve, and gains here compound across your entire list.
- At risk (75 to 83%): A meaningful portion of your emails are landing in spam. Audit your authentication, list hygiene, and sending patterns immediately.
- Poor (below 75%): Significant revenue is being lost to the spam folder. This needs urgent attention before ISPs further penalize your sender reputation.
High-performing DTC brands typically aim above 90% inbox placement and use consistent monitoring to stay there. That is not just a vanity metric. At scale, moving from 84% to 91% inbox placement across a list of 100,000 subscribers means 7,000 more people reading your campaign per send. That compounds fast. Review your email management best practices to understand how top brands maintain these numbers.
Factors impacting deliverability rates for e-commerce brands
Knowing the right numbers is just the start. Now let us explore what actually drives your deliverability rates day to day.
Deliverability is not a single lever. It is a combination of technical infrastructure, list health, and behavioral signals that ISPs analyze every time you send. Here are the biggest factors, in order of impact:
- Authentication setup (SPF, DKIM, DMARC): These protocols verify that your emails are genuinely from your domain. Without them, ISPs treat your mail as suspicious. Authentication and list hygiene are the foundation of sustained high deliverability, keeping bounce rates under 2%.
- Sender reputation and IP warm-up: A new IP address with no sending history looks risky to ISPs. Gradually increasing send volume over weeks builds a positive reputation before you go full scale.
- List hygiene: Sending to invalid, inactive, or purchased addresses tanks your sender score fast. Never buy lists. Scrub your list regularly and remove addresses that have not engaged in 90 to 180 days.
- Hard bounce management: A hard bounce signals an invalid address and should be removed immediately. Letting bounces accumulate above 2% is a fast path to spam folder territory.
- Engagement signals: ISPs watch how recipients interact with your emails. High open rates, clicks, and low spam complaints tell Gmail and Outlook that your content belongs in the inbox.
- Volume spikes: Suddenly jumping from 10,000 to 100,000 emails per week triggers ISP red flags. Consistent, predictable sending patterns build trust over time.
Pro Tip: Segment your list by engagement recency before every major campaign. Sending only to active subscribers first, then gradually including lapsed ones, protects your sender reputation and keeps your email design best practices working harder for you. This is one of the fastest ways to lift inbox placement without changing a single line of copy. Reference proven email best practices to see how engagement-first sending structures work in practice.
Testing and monitoring: Maintaining high deliverability
Understanding causes is key, but staying on top of deliverability requires systematic testing and alerts. Here is how to make that easy.
Deliverability is not a set-it-and-forget-it metric. ISP algorithms update constantly, and a sender reputation built over months can erode in weeks. The brands that consistently land in the inbox build monitoring into their workflow, not just their quarterly reviews.

The two main approaches are spot checks and ongoing monitoring. Seed testing and Postmaster Tools allow you to monitor inbox placement continuously, clean lists monthly, and track engagement ratios for real ROI. Seed testing sends your campaign to a set of test addresses across all major ISPs before the real send, letting you catch spam folder routing early. Google Postmaster Tools gives you domain reputation data directly from Gmail, which is invaluable if Gmail represents a large share of your audience.
Here is a comparison of the main monitoring options:
| Tool | Best for | Key strength |
|---|---|---|
| Google Postmaster Tools | Gmail-heavy lists | Domain/IP reputation direct from Google |
| ESP dashboards (Klaviyo, etc.) | Overall list health | Bounce, unsubscribe, open rate tracking |
| GlockApps / Mail-Tester | Pre-send inbox checks | Seed testing across multiple ISPs |
| MXToolbox | Technical setup audits | SPF, DKIM, DMARC, blacklist checks |
For most e-commerce brands, a monthly cadence for list cleaning paired with weekly monitoring of key metrics covers the basics. Work with deliverability consultants if your brand is scaling rapidly or if you are seeing unexplained drops in open rates.
Watch for these warning signs that your deliverability is slipping:
- Open rates drop more than 10% week over week with no creative change
- Spam complaint rate rises above 0.1%
- Hard bounce rate climbs past 2%
- Google Postmaster shows domain reputation dropping from “High” to “Medium”
- Sudden drop in revenue from email despite consistent send volume
Any one of these signals is a reason to pause, audit, and adjust before the problem compounds. Use these checkpoints to optimize your email ROI systematically, not reactively.
Why aiming for ‘great’ beats settling for ‘good’ deliverability
Everything up to now has mapped the standards. Let us consider why “good enough” should never be the goal for ambitious brands.
Here is what most e-commerce teams miss: deliverability gains are not linear. Moving from 84% to 91% inbox placement does not improve your results by 7%. It can improve them by 20 to 30% in practice, because the subscribers you recover tend to be in your most valuable segments. They are the ones ISPs were quietly filtering out.
Most brands stop optimizing once they hit the industry average. They see 85% and feel comfortable. But that mindset leaves real revenue on the table, especially for high-growth brands going deeper on deliverability as a retention lever. The top performers we work with treat every percentage point above average as a competitive advantage, not a bonus.
The uncomfortable truth is that “average” deliverability is increasingly dangerous. As inbox filters get smarter, the difference between good senders and mediocre ones becomes more pronounced, not less. Brands that invest in authentication, engagement-first sending, and continuous monitoring now will widen the gap from competitors who coast on acceptable numbers. Every email that lands in the inbox instead of spam is compounding long-term customer lifetime value. That is the only metric that truly matters.
Expert help to boost your deliverability rates
Ready to move from benchmarks to results? The Email Marketers work with growth-focused e-commerce brands to close the gap between acceptable and exceptional deliverability. Our team has built the systems, flows, and segmentation strategies that move brands from “at risk” to “top performer” territory. Explore real brand case studies to see how that looks in practice, and check out the Retention Lab for tools and frameworks built specifically for e-commerce retention marketing. When you are ready for a strategic partner, our email marketing experts are here to build a deliverability-first retention engine for your brand.
Frequently asked questions
What is the difference between delivery rate and deliverability rate?
Delivery rate tracks how many emails are accepted by recipient mail servers, while deliverability rate measures how many of those emails reach the primary inbox. Server acceptance should sit at 98% or above, but inbox placement is what drives actual engagement and revenue.
What is a good email deliverability rate for e-commerce brands?
A solid deliverability rate falls between 84 and 89%, which aligns with current global benchmarks. Top-performing e-commerce brands consistently push above 90% by maintaining strong authentication, list hygiene, and engagement-based sending practices.
How can I improve my email deliverability rate?
Start with your technical foundation: set up SPF, DKIM, and DMARC authentication on your sending domain. Then maintain list hygiene and authentication standards, segment by engagement recency, and monitor your inbox placement weekly rather than only after a problem appears.
How often should I clean my email list for high deliverability?
E-commerce brands should clean their lists at least once a month to minimize bounces and remove spam traps before they damage sender reputation. Monthly list cleaning combined with ongoing engagement monitoring is the baseline habit that separates strong senders from average ones.


