.png)


Email Performance Metrics 2025: What E-Commerce Marketers Need

TL;DR:
- In 2025, click-based metrics like CTR and CTOR have become core indicators of email engagement, replacing unreliable open rates. Building automation flows, especially product back-in-stock emails, significantly boosts revenue, with flows generating over 40% of total email income. Marketers should focus on tracking trends, optimizing automation, and interpreting metrics within the measurement environment to improve performance effectively.
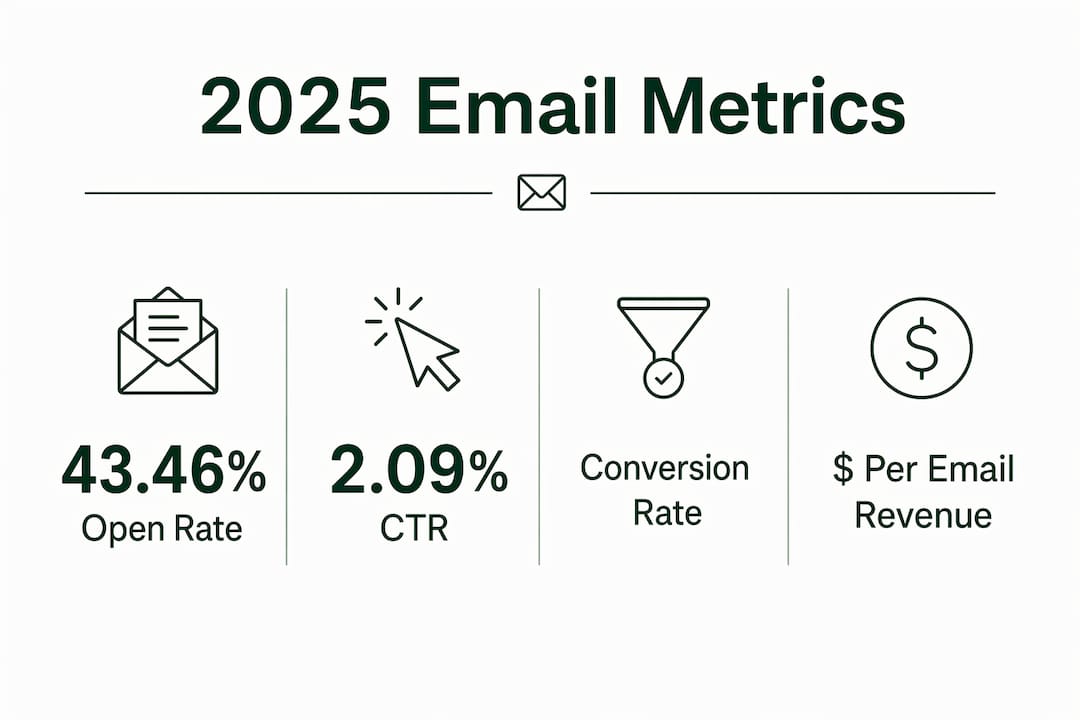
Email performance metrics are quantitative measures that reveal how well your campaigns engage subscribers, drive conversions, and generate revenue. In 2025, the standard industry term for this discipline is email marketing measurement, and the benchmarks have shifted significantly. MailerLite reports a 2025 median open rate of 43.46%, a CTR of 2.09%, and a CTOR of 6.81%, but the more important story is which metrics you should actually trust. Privacy changes from Apple and Gmail have made open rates unreliable, pushing click-based email KPIs 2025 to the front of every serious analyst’s dashboard.
What are the key email performance metrics to track in 2025?
The metrics that matter most in 2025 fall into three tiers: deliverability, engagement, and business outcomes. Each tier feeds the next, and weakness in one will suppress performance across the others.

Deliverability metrics set the floor. Keep hard bounce rate below 0.5% and spam complaint rate below 0.1% to protect inbox placement. A complaint rate at 0.1% begins degrading deliverability, and 0.3% risks serious filtering by Gmail and Yahoo. These thresholds are non-negotiable preconditions for everything else.
Engagement metrics are where interpretation gets complicated. Open rate, once the headline number, is now a distorted signal. Roughly 50% of email opens occur in Apple Mail clients, where pixel pre-loading fires an “open” event regardless of whether a human actually read the email. Treat open rate as a directional trend, not a precise measure.
CTR and CTOR are the two email engagement metrics that deserve your full attention:
- CTR (click-through rate): Unique clicks divided by emails delivered. Unaffected by pixel pre-loading, making it the most reliable engagement signal post-privacy changes.
- CTOR (click-to-open rate): Clicks divided by opens. Measures content relevance among those who opened. A strong CTOR with weak conversion usually points to a landing page problem, not an email problem.
- Unsubscribe rate: MailerLite’s 2025 median unsubscribe rate rose to 0.22% from 0.08% in 2024, largely driven by Gmail’s Manage Subscriptions feature. This jump is partly a measurement artifact, not purely a signal of list fatigue.
Business outcome metrics close the loop. Conversion rate and revenue per email tell you whether engagement translates to actual sales. For ecommerce, these are the numbers that connect your email program to the P&L.
Pro Tip: Build your reporting dashboard around CTR, CTOR, conversion rate, and revenue per recipient as your core email KPIs 2025. Use open rate only to spot large directional shifts, such as a sudden 20-point drop that might indicate a deliverability problem.
| Metric | 2025 Benchmark | What it measures |
|---|---|---|
| Open rate | 43.46% median | Directional trend only due to privacy inflation |
| CTR | 2.09% median | Actual click engagement, most reliable signal |
| CTOR | 6.81% median | Content relevance among openers |
| Unsubscribe rate | 0.22% median | List fatigue, but interpret cautiously post-Gmail changes |
| Hard bounce rate | Below 0.5% | List hygiene and deliverability health |
How do email benchmarks vary by industry and email type?
Aggregate benchmarks are a starting point, not a verdict. Your industry vertical and the type of email you send matter far more than the overall median when setting realistic targets.
Lifecycle automated emails outperform broadcast campaigns by a wide margin. Automated emails generate approximately $3.41 revenue per email versus $0.155 for campaigns, a 22x difference. Automated emails also convert at 1.49% compared to 0.08% for campaigns, roughly 19x higher. The reason is simple: automated emails reach subscribers at the exact moment of behavioral intent, while campaigns reach everyone regardless of where they are in the purchase cycle.
Breaking down specific lifecycle flows reveals even sharper contrasts:
Welcome emails deliver a CTR of 3.94% and a conversion rate of 2.11%. Abandoned cart emails hit a CTR of 4.13% and a conversion rate of 1.72%. Both outperform typical campaign benchmarks by a factor of 10 or more. The standout performer, however, is the product back-in-stock email, which achieves a 21.31% CTR and a 6.72% conversion rate. That CTR is roughly ten times the campaign median, and it makes intuitive sense: a subscriber who signed up to be notified about a specific product is the warmest possible lead.
Pro Tip: If your brand does not yet run a product back-in-stock flow, that is your single highest-ROI automation to build next. Only 0.6% of brands currently use this flow, which means the competitive window is wide open.
The revenue concentration inside automation is striking. Flows generate approximately 41% of total email revenue from only 5.3% of total sends. Campaigns drive the majority of send volume but a minority of revenue. For ecommerce brands, this ratio is the clearest argument for investing in lifecycle automation before scaling campaign frequency.
Industry-level benchmarks also shift the goalposts. Retail and e-commerce brands typically see lower open rates than B2B or nonprofit senders, but higher conversion rates when automation is properly configured. Comparing your CTR against a cross-industry average is less useful than comparing it against ecommerce-specific data from sources like Omnisend or MailerLite, which segment by vertical.
What are common pitfalls in interpreting 2025 email metrics?
Misreading your metrics is often more damaging than having no metrics at all. Three specific distortions are causing the most misoptimization in 2025.
Apple Mail Privacy Protection (MPP) inflates open rates. When Apple pre-loads email pixels on its servers, every email sent to an Apple Mail user registers as “opened” whether or not the subscriber ever saw it. Marketers should treat open rates as trend indicators, not precise engagement measures. If you are making send-time optimization or subject line decisions based on open rate alone, you are optimizing against noise.
Gmail Manage Subscriptions distorts unsubscribe counts. Gmail’s feature allows users to unsubscribe from multiple senders at once, which inflates total unsubscribe counts by triggering multiple unsubscribe events from a single user action. Monitoring unique unsubscribes rather than total unsubscribes is the correct approach. A spike in total unsubscribes after a Gmail batch action is a measurement artifact, not evidence that your content suddenly became irrelevant. You can find practical guidance on managing this in Theemailmarketers’ breakdown of unsubscribe rate interpretation.
Cross-platform metric definitions vary. Klaviyo, Mailchimp, and Omnisend do not all calculate CTR or CTOR identically. Some platforms count total clicks; others count unique clicks. Normalizing metric definitions across tools before benchmarking is a prerequisite for valid analysis. If you switch ESPs mid-year and your CTR appears to drop 30%, the first question should be whether the new platform calculates the metric differently.
The practical guidance here is to:
- Prioritize CTR, CTOR, and conversion rate as your primary email engagement metrics
- Track unsubscribe rate as a rolling 30-day trend, not a per-campaign snapshot
- Monitor bounce rate and spam complaint rate weekly as early warning signals for deliverability issues
- Document your platform’s metric definitions before comparing against external benchmarks
Pro Tip: When a metric spikes or drops unexpectedly, always ask “Is this a measurement change or a behavior change?” before acting. Gmail Manage Subscriptions and Apple MPP have caused more reactive list pruning and subject line overhauls than any genuine performance shift in 2025.
How can ecommerce marketers optimize strategy using 2025 performance insights?
Benchmarks are only useful if they drive decisions. Here is how to translate the 2025 data into a concrete optimization roadmap.
-
Set tiered KPI targets by email type. A welcome email should be held to a 3%+ CTR target. A promotional campaign email should target 1.5% to 2%. Applying the same benchmark to both obscures performance and leads to false conclusions about what is working.
-
Audit your automation coverage before scaling campaigns. If flows contribute less than 40% to 50% of your total email revenue, you have an automation gap. Build or repair welcome series, abandoned cart, post-purchase, and back-in-stock flows before adding more campaign sends. The revenue leverage from automation is simply too large to leave on the table.
-
Use CTOR to diagnose content quality, then use conversion rate to diagnose post-click experience. A CTOR above 8% with a conversion rate below 0.5% almost always points to a landing page or checkout friction problem, not an email problem. Fix the destination before rewriting the email.
-
Monitor spam complaint rate weekly. Most marketers check this monthly or not at all. A complaint rate trending toward 0.08% is a warning sign worth acting on immediately, before it crosses the 0.1% threshold that triggers deliverability degradation. Reviewing email deliverability fundamentals helps contextualize where your program stands.
-
Segment your benchmark analysis by list source. Subscribers acquired through paid social convert differently than organic subscribers or loyalty program members. Blending them into a single conversion rate average hides the segments that are underperforming and the ones that are over-delivering.
-
Connect email metrics to revenue reporting. CTR and CTOR are engagement proxies. Revenue per recipient and customer lifetime value are the outcomes that justify budget. Build a reporting view that shows both, and use it to make the case for email investment internally.
Pro Tip: Run a quarterly metric audit where you compare your CTR, CTOR, and conversion rate against the 2025 ecommerce benchmarks from Omnisend and MailerLite. Gaps of more than 30% below benchmark in any metric signal a specific, fixable problem.
Key takeaways
Reliable email measurement in 2025 requires prioritizing CTR, CTOR, and conversion rate over open rate, while treating unsubscribe data as a trend signal rather than a per-campaign verdict.
| Point | Details |
|---|---|
| Open rate is unreliable | Apple MPP inflates opens; use CTR and CTOR as primary engagement signals instead. |
| Automation drives outsized revenue | Automated flows generate 22x more revenue per email than broadcast campaigns. |
| Unsubscribe data needs context | Gmail Manage Subscriptions inflates totals; track unique unsubscribes over rolling 30-day periods. |
| Deliverability thresholds are non-negotiable | Keep hard bounce rate below 0.5% and spam complaints below 0.1% to protect inbox placement. |
| Benchmarks must match email type | Welcome and abandoned cart flows should be measured against automation benchmarks, not campaign averages. |
The metric that actually tells you the truth
I have spent years reviewing email programs for ecommerce brands, and the single most common mistake I see is a team celebrating a 50% open rate while their CTR sits at 0.8% and their flows contribute 15% of email revenue. The open rate number feels good. The business outcome is not.
The shift away from open rate as a primary signal is not just a technical adjustment forced by Apple MPP. It is an opportunity to build a more honest measurement culture. When you stop optimizing for a vanity metric, you start asking harder and more useful questions: Did people click? Did they buy? Did the right segment receive this message at the right moment?
Automated flows are where I see the most untapped revenue in ecommerce email programs. The data is unambiguous. Flows generate 41% of email revenue from 5.3% of sends. Yet most brands I audit have a broken welcome series, no back-in-stock flow, and a post-purchase sequence that ends after one email. That is not a content problem. It is a prioritization problem.
The other thing I would push back on is the instinct to react to every metric movement. A spike in unsubscribes after a Gmail batch action is not a crisis. A 5-point drop in open rate after Apple MPP expanded its reach is not a deliverability emergency. The marketers who perform best in 2025 are the ones who track trends over weeks, not individual campaign snapshots, and who ask “what changed in the measurement environment?” before changing their strategy.
Balance your engagement metrics with revenue outcomes. CTR tells you people are interested. Conversion rate tells you the interest converted to value. Revenue per recipient tells you whether the program is worth running. Use all three together, and you will make better decisions than 90% of the teams you compete against.
— Melanie
How Theemailmarketers can help you act on these insights
Theemailmarketers works exclusively with ecommerce brands to build email programs that perform against the metrics that actually matter: CTR, CTOR, conversion rate, and revenue per recipient. The team builds and optimizes lifecycle automation flows, develops segmentation strategies grounded in behavioral data, and runs metric-driven campaigns designed to grow customer lifetime value. If your flows are contributing less than 40% of email revenue or your abandoned cart sequence is underperforming the 1.72% conversion benchmark, there is a clear and fixable gap. Review the client results to see how Theemailmarketers has closed that gap for 8-figure DTC brands. For brands ready to build a retention program from the ground up, the Retention Lab is the place to start.
FAQ
What is a good email CTR benchmark for ecommerce in 2025?
MailerLite reports a 2025 median CTR of 2.09% across all industries. Ecommerce lifecycle emails like abandoned cart flows typically achieve CTRs above 4%, making them a more useful benchmark for automated sends.
Why are email open rates unreliable in 2025?
Apple Mail Privacy Protection pre-loads email tracking pixels on Apple’s servers, registering an “open” event regardless of whether the subscriber actually viewed the email. Approximately 50% of email opens now occur in Apple Mail clients, which means open rate data is significantly inflated.
How does Gmail Manage Subscriptions affect unsubscribe metrics?
Gmail’s feature allows users to unsubscribe from multiple senders simultaneously, which inflates total unsubscribe counts with multiple events from a single user action. Marketers should track unique unsubscribes over a rolling 30-day period to get an accurate read on list health.
What is the difference between CTR and CTOR?
CTR measures unique clicks divided by total emails delivered and reflects overall campaign engagement. CTOR measures clicks divided by opens and indicates how relevant your content was to the subscribers who actually opened the email.
How much revenue should email automation contribute to total email revenue?
According to data from email10k.com, flows should contribute at least 50% to 60% of total email revenue for ecommerce brands. Programs where automation contributes less than 40% have a significant optimization opportunity in their lifecycle flows.


