.png)


Email Marketing Performance Metrics That Drive Real Revenue

TL;DR:
- Most marketers rely on vanity metrics like open and click rates, which often fail to connect to revenue. Building a comprehensive measurement system involves integrating CRM data and focusing on engagement, pipeline, and revenue metrics. Emphasizing trust indicators and detailed cohort analysis helps optimize long-term email program effectiveness.
Most marketers are flying blind. Email marketing generates ROI between $10 and $36 for every dollar spent, yet 72% of marketers cannot accurately measure their campaign ROI because they’re fixated on open rates and click counts. These email marketing performance metrics feel productive to track, but they often mask a fundamental problem: engagement data that never connects to revenue. If you’re ready to move beyond vanity metrics and build a measurement system that actually reflects business outcomes, this guide breaks down exactly how to do it.
Table of Contents
- Key Takeaways
- Email marketing performance metrics: what you’re probably getting wrong
- Beyond clicks: integrating pipeline and revenue metrics
- New metrics reshaping email measurement in 2026
- How to analyze email marketing data for real improvement
- My take on where most email programs go wrong
- How The Email Marketers can help you measure what matters
- FAQ
Key Takeaways
| Point | Details |
|---|---|
| Vanity metrics distort reality | Open and click rates alone don’t reveal whether email campaigns generate revenue or business growth. |
| Three-tier framework matters | Organize metrics into engagement, pipeline, and revenue tiers to get a full picture of campaign performance. |
| Privacy changes demand adaptation | Apple’s Mail Privacy Protection makes open rates directional signals, not precise KPIs, requiring smarter measurement approaches. |
| Emerging metrics build trust | The Disaffection Index and reply rate measure subscriber relationships more accurately than traditional engagement signals. |
| Small gains compound big revenue | Incremental improvements across deliverability, open rates, and click rates multiply into significant revenue outcomes. |
Email marketing performance metrics: what you’re probably getting wrong
Every email platform hands you the same dashboard: opens, clicks, unsubscribes, bounces. These email campaign metrics are useful starting points, but treating them as the finish line is where most programs stall.
Here’s how each core metric is calculated and what it actually tells you:
- Open rate: (Unique opens ÷ Emails delivered) × 100. Historically the first signal of subject line and sender reputation health.
- Click-through rate (CTR): (Unique clicks ÷ Emails delivered) × 100. Reflects whether your content and offer motivate action.
- Click-to-open rate (CTOR): (Clicks ÷ Opens) × 100. A sharper view of content relevance among those who actually opened.
- Bounce rate: (Bounced emails ÷ Emails sent) × 100. High bounce rates damage sender reputation and deliverability.
- Unsubscribe rate: (Unsubscribes ÷ Emails delivered) × 100. Signals list health and content-audience fit.
- Deliverability rate: (Emails delivered ÷ Emails sent) × 100. The foundation everything else depends on.
The problem with this list? Open rates are now unreliable as precise KPIs because Apple’s Mail Privacy Protection pre-loads email pixels, logging opens that never happened. You can still use open rates for trend analysis and comparative A/B testing, but building strategy around specific open rate targets has become dangerously misleading.
Pro Tip: Use CTOR instead of raw open rate to gauge content performance. Since CTOR only counts people who opened, it filters out most of the MPP noise and gives you a cleaner read on whether your message actually resonated.
Clicks and opens also tell you nothing about what happens after the subscriber reaches your site. A 4% CTR means little if the landing page converts at 0.3%. The email did its job. Your funnel didn’t. You need more visibility into the full customer journey to diagnose that accurately.
Beyond clicks: integrating pipeline and revenue metrics
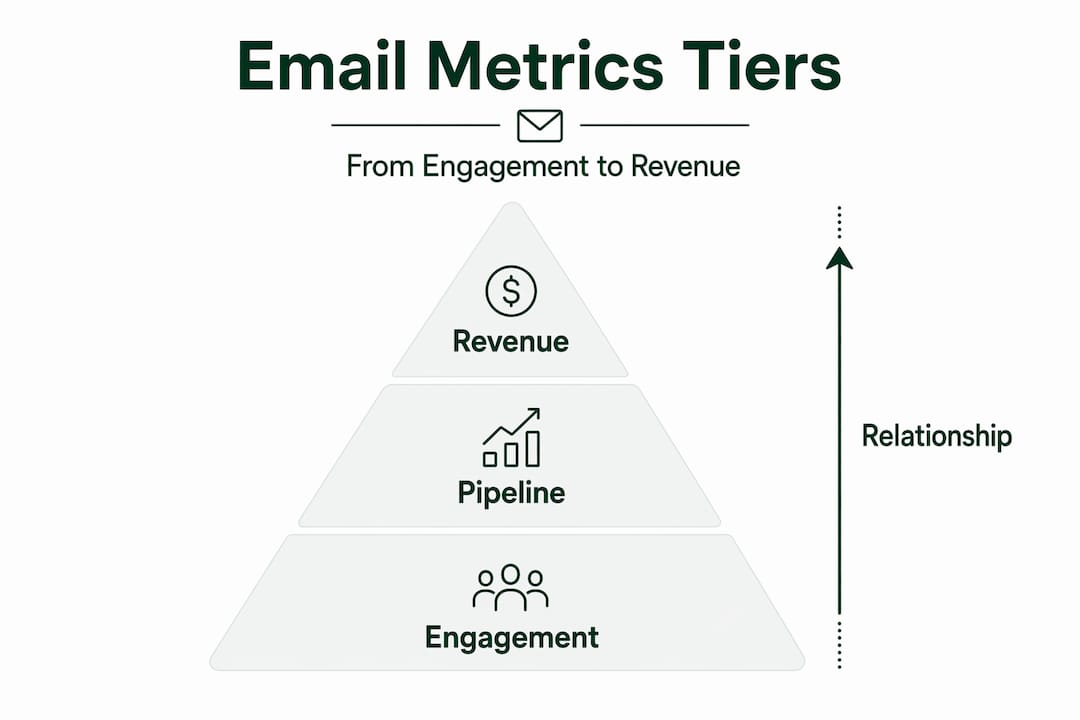
The best email performance indicators aren’t found in your email platform. They live at the intersection of your email tool and your CRM. Connecting these systems unlocks a three-tier framework that transforms how you measure success.
Tier 1: Engagement metrics serve as diagnostic signals. Use them to troubleshoot timing, subject lines, and content. They’re early warnings, not business outcomes.
Tier 2: Pipeline metrics track how email activity converts into sales momentum. These include:
| Pipeline Metric | What It Measures |
|---|---|
| Email-to-lead rate | Percentage of email recipients who become tracked leads |
| Campaign-to-opportunity | Leads from a campaign that move into active sales opportunities |
| Deal-stage touchpoints | Number of email touches at each stage of the sales pipeline |
Integrating CRM with email marketing tools is what makes these pipeline metrics visible. Without that connection, you’re guessing which campaigns actually drive pipeline. Successful integration requires unique campaign identifiers and a consistent attribution model, whether you use first-touch, last-touch, or multi-touch attribution.
Tier 3: Revenue metrics are where the real story lives. Revenue per email sent is calculated simply: total campaign revenue divided by number of emails sent. Leadership understands this number immediately. Revenue per subscriber tells you the long-term health of your list. And customer lifetime value, which only 22% of marketing decision-makers currently factor into campaign success measurement, gives you the most complete picture of whether your email program is building a sustainable business asset.

Pro Tip: When setting up CRM-email integration, tag every campaign with a unique identifier at the start. Retroactively connecting campaign data is painful and often incomplete. Build the habit before you need the data.
One underappreciated finding: automated email sequences account for only about 2% of total sends but generate roughly 41% of total email revenue. That ratio alone should reshape how you allocate your measurement and optimization attention. Understanding email marketing ROI at this level of detail is what separates programs that grow from programs that plateau.
New metrics reshaping email measurement in 2026
The email industry is moving beyond clicks and opens toward metrics that measure actual subscriber relationships. Three indicators are gaining serious traction among sophisticated marketers.
The Disaffection Index combines three negative signals into one composite score: unsubscribes, spam complaints, and hard bounces. Individually, each metric gets monitored. Together, they tell you whether your list is actively pulling away from you. A rising Disaffection Index is a sender reputation warning that typically precedes inbox placement problems by several weeks.
Reply rate is emerging as one of the most meaningful trust signals available to email marketers. Unlike a click, a reply requires genuine intent. A 1% reply rate is considered a significant trust signal by mailbox providers, who interpret subscriber replies as evidence that your content belongs in the inbox. This matters because mailbox providers prioritize trust signals over clicks or opens when making inbox placement decisions.
Here’s what makes reply rate especially powerful for e-commerce brands: it’s nearly impossible to fake. You can’t automate your way to a high reply rate the way you can inflate open counts. Every reply represents a real human who found your message worth responding to.
The third emerging framework is trust quantification, which breaks subscriber trust into four components:
- Credibility: Does your content demonstrate actual expertise?
- Reliability: Do you send what you say you’ll send, when you say you’ll send it?
- Intimacy: Does your messaging reflect genuine understanding of the subscriber?
- Self-orientation: Are your emails designed to serve the subscriber or primarily serve your sales goals?
Brands that score well across these four dimensions tend to see better email marketing KPIs across the board, not because trust is a nice-to-have but because inbox providers, algorithms, and human subscribers all reward it consistently.
How to analyze email marketing data for real improvement
Knowing which metrics to track is only half the job. Knowing how to act on them is what separates high-performing programs from average ones. Here’s a practical framework for analyzing email marketing data and extracting decisions from it.
-
Separate metrics from KPIs. A metric is any number you can measure. A KPI is a metric tied to a specific business goal with a target attached. Choosing meaningful KPIs means asking: “What does success look like for this campaign, and which number proves we got there?” Open rate is a metric. Revenue per email sent is a KPI for a revenue-focused program.
-
Segment before you analyze. Aggregate numbers hide performance variation. 90% of email marketers who segment audiences report better performance. Segment by acquisition source, purchase history, engagement tier, and lifecycle stage. Then compare metrics across segments to find your highest-value audiences and your most disengaged ones.
-
Build an engagement scoring model. Assign point values to different actions: opens (low weight post-MPP), clicks, purchases, replies, and time since last engagement. Subscribers above a threshold score are your active audience. Below a threshold, they’re candidates for re-engagement flows or list suppression. This scoring approach creates the foundation for what KPIs you should track at each lifecycle stage.
-
Use cohort analysis for seasonal programs. Compare the cohort of customers acquired through a Black Friday campaign this year against the same cohort from last year. Revenue per subscriber in the 90 days post-acquisition tells you whether your campaigns are attracting higher-value buyers over time.
-
Look past the click. Poor conversion rates often result from landing page friction or checkout problems rather than email failures. If CTR is strong but conversion is weak, the email is working. The fix lives on the destination page.
Pro Tip: Run a quarterly funnel math exercise. Track deliverability, open rate, CTR, and conversion rate together. Improving each stage incrementally from 92% to 97% deliverability, 20% to 23% open rate, and 2.5% to 3.0% CTR compounds multiplicatively into revenue gains most marketers never calculate until they see the final number.
Set a consistent review cadence: weekly for list health signals, monthly for funnel performance, quarterly for revenue per subscriber trends. Without a cadence, analysis becomes reactive rather than strategic.
My take on where most email programs go wrong
I’ve reviewed hundreds of email programs, and the pattern is almost always the same. Marketers spend enormous energy optimizing subject lines and send times while never once looking at revenue per subscriber. They celebrate a 28% open rate without knowing whether that campaign generated $400 or $40,000.
The shift from engagement metrics to revenue metrics is harder than it sounds. It requires CRM integration, clean campaign tagging, and a willingness to accept that some high-open-rate campaigns are actually underperforming on revenue. That’s uncomfortable. It challenges narratives that teams have built their reporting around.
What I’ve found to be true: the brands that invest in connecting their email data to CRM outcomes tend to discover that their most “boring” campaigns, the ones with modest open rates, are often their most profitable. Automated post-purchase sequences and loyalty re-engagement flows routinely outperform flashy promotional campaigns when you measure revenue per email sent.
The trust quantification framework is the piece most marketers skip entirely. It feels qualitative. But reply rate data, Disaffection Index trends, and inbox placement rates are all measurable expressions of subscriber trust. When I see a program with strong engagement metrics but declining inbox placement, it’s almost always a trust problem, not a content problem.
My recommendation: build your measurement system around the three-tier framework and review revenue metrics with the same frequency you review open rates. The programs that do this consistently see the compounding improvements that make email the highest-ROI channel in the marketing mix.
— Melanie
How The Email Marketers can help you measure what matters
If the gap between your current reporting and the three-tier metrics framework feels wide, you’re not alone. Most e-commerce brands are collecting data but not connecting it to revenue in a way that drives real decisions. The Email Marketers specializes in exactly this work: building automated flows, segmentation strategies, and CRM-integrated reporting that connects every email touchpoint to measurable outcomes. Their client results demonstrate consistent revenue growth across DTC brands that committed to data-driven retention marketing. Whether you need a full metrics overhaul or targeted improvements to specific lifecycle stages, The Email Marketers bring the strategic depth that turns email data into a genuine competitive advantage. Explore their retention marketing toolkit to see how a structured approach to email performance measurement translates into repeat purchases and higher customer lifetime value.
FAQ
What are the most important email marketing performance metrics?
The most important metrics depend on your goals, but a complete view requires engagement metrics (CTR, CTOR), pipeline metrics (email-to-lead rate), and revenue metrics (revenue per email sent, revenue per subscriber). Open rate alone is insufficient since Apple’s Mail Privacy Protection compromised its accuracy.
How do I calculate revenue per email sent?
Divide the total revenue attributed to a campaign by the total number of emails sent in that campaign. This outcome-based metric gives leadership a clear, dollar-denominated measure of email performance that click and open data cannot provide.
What is the Disaffection Index?
The Disaffection Index is a composite metric combining unsubscribes, spam complaints, and hard bounces into a single score that signals audience disengagement. A rising score is an early warning for sender reputation damage and inbox placement problems.
Why is reply rate considered a trust signal?
Mailbox providers treat subscriber replies as evidence that your emails are welcome and relevant, which directly influences inbox placement. A 1% reply rate is considered a meaningful trust signal because replies require genuine intent and cannot be automated or accidentally triggered.
How do metrics differ from KPIs in email marketing?
A metric is any measurable data point, while a KPI is a metric tied to a specific business goal with a defined target. Choosing the right KPIs means selecting the metrics that most directly reflect whether your email program is achieving its intended business outcomes.


